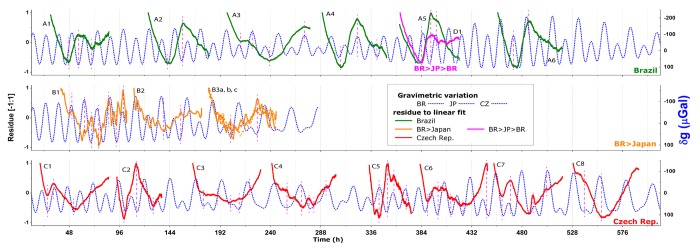
Figure 1. Normalized residue of Photon counts data (Fig. S1) to a linear growth fit: Brazilian samples in Limeira/BR (A series, top), traveled to Hamamatsu/Japan (B, middle) and back to Brazil (D1, top on A5), and Czech samples in Prague (C, bottom), plotted against the contemporaneous local gravimetric acceleration oscillation (δg). Vertical marks (dash lines) over singular PC points.
