
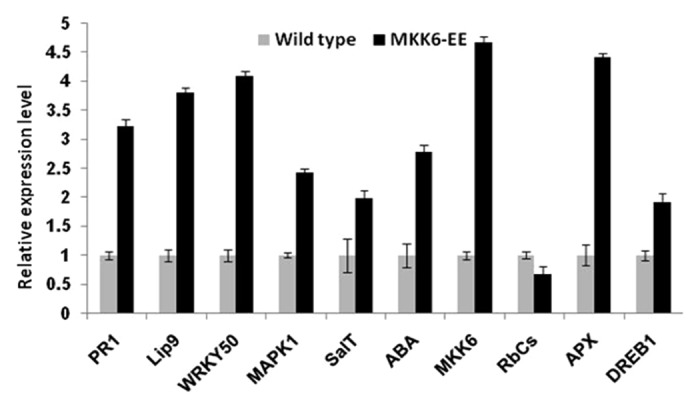
Figure 2. Real-time PCR quantification of relative expression levels of important genes regulated under different abiotic stress. Black bar denotes control wild type plant and gray bar denotes OsMKK6EE overexpressed transgenic plants. Error bars indicate standard error of three independent biological samples.