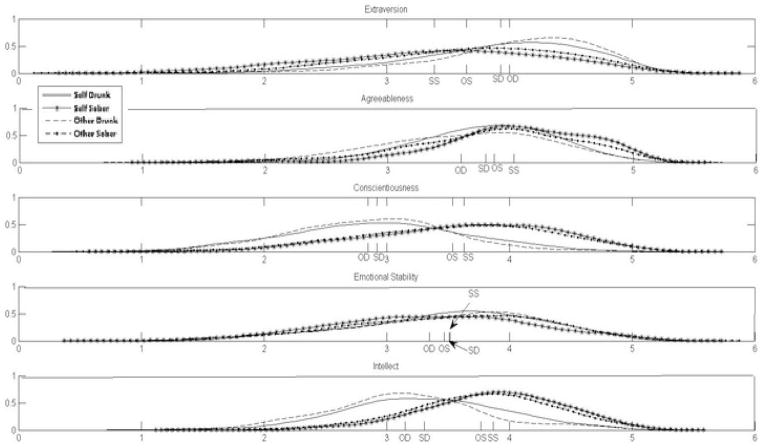
Figure 1.
Probability density functions of personality scale scores as reported by target (of self) and other (of target) for both sober and drunk conditions (N = 374).
Note: The vertical bars represent the raw means of the respective groups (i.e., Self Sober, Self Drunk, Other Sober, Other Drunk). The density functions are graphed using kernel density estimation, a smoothing procedure.

