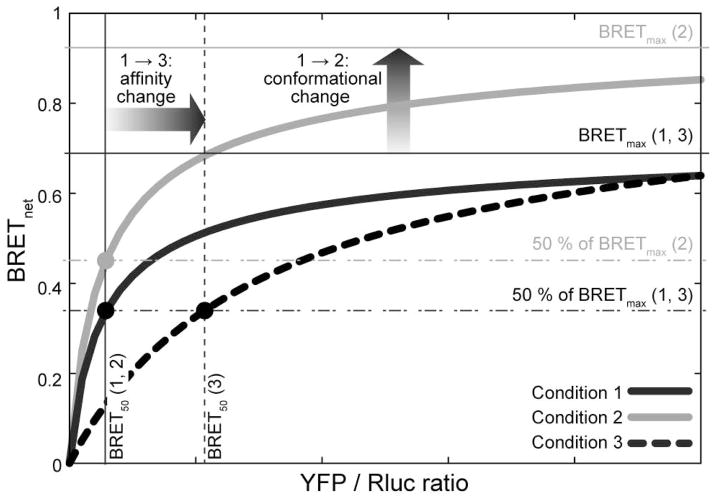
Figure 5.
Interpretation of curves obtained in a “conventional” BRET titration experiment as proposed in [49]. Variations in the BRETmax suggest a conformational change between the binding partners while variations in BRET50 are interpreted as changes in association affinity. The limits of applicability of this scheme are discussed in text.

