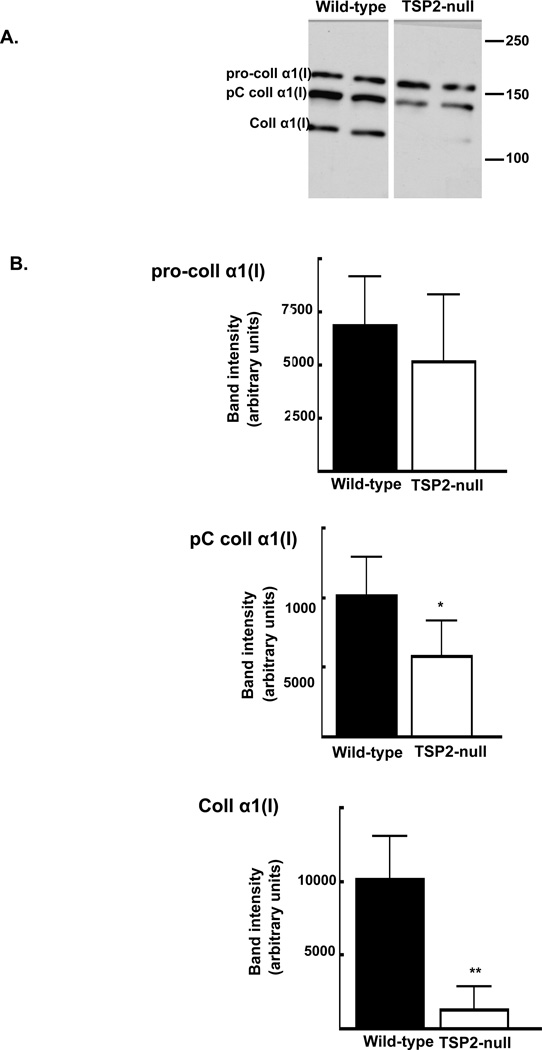
Figure 5. Levels of mature α1(I) collagen are reduced in the absence of TSP2.
After 10 days in osteoblastic culture, type I collagen levels determined in cell-conditioned medium by Western. A: Representative blot. B: Intensities of the pro-collagen α1(I) (top panel), pC collagen α1(I) (middle panel), and fully processed collagen α1(I) (bottom panel) were determined using histograms generated in ImageJ. Bars are mean and SD of data obtained from 3 independent experiments totaling of 12 wells per genotype. * p<0.001, ** p<0.0001.

