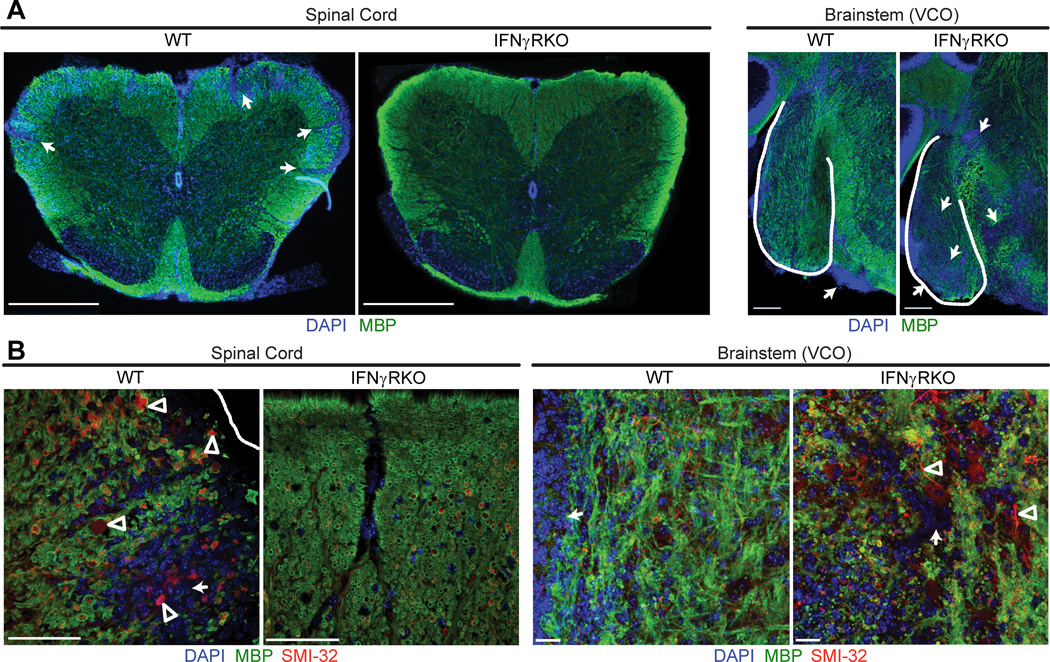
Figure 1.
The distribution of inflammatory demyelination in the CNS of mice with atypical and conventional EAE. (A) Representative spinal cord (left) and brainstem (right) sections from WT mice with conventional EAE and IFNγRKO mice with atypical EAE. Sections were stained for MBP (green) and DAPI (blue) to define foci of inflammatory demyelination (arrows). Scale bars are 500 µm in the spinal cord images and 100 µm in the brainstem images. (B) Confocal images of spinal cord and brainstem sections stained for MBP (green), SMI-32 (red), and DAPI (blue). Demyelinated axons are SMI-32 positive, MBP negative (arrowheads). Scale bars, 30 µm.

