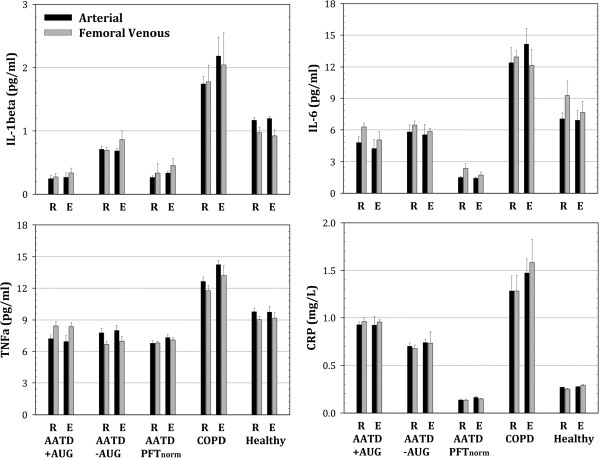
Figure 3.

Summary comparison of arterial (black bars) and femoral venous (gray bars) serum levels for cytokines at rest (R) and during exercise (E) highlighting the observation of, 1) no significant response to exercise and, 2) no significant difference between arterial and femoral venous serum levels among subject groups. ‘R’ values are averaged data from rest and post-exercise ‘recovery’ time points shown in Figures 1 and 2. ‘E’ values are averaged for all exercise time points shown in Figures 1 and 2. Overall subject group differences are clearly present (as shown in Figures 1 and 2), but statistical notation of these differences are not recapitulate on this summary figure.
