
Figure 4.
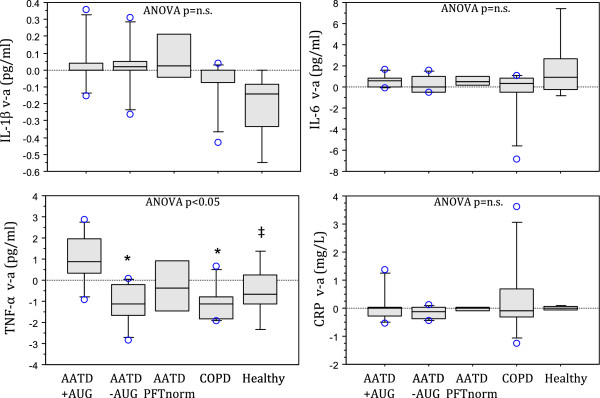
Box plot showing femoral venous-minus-arterial (v-a) cytokine values obtained from mean venous and arterial data represented for groups in Figures1and2. Venous values are obtained from the femoral vein, therefore v-a > 0 imply muscle efflux of cytokines, whereas v-a < 0 imply muscle uptake. Zero v-a values imply no muscle involvement. Box boundaries show 25th and 75th percentile, while whisker bars represent 10th and 90th percentile. All observations >90th percentile are individually represented as open circle (ο) data point. Group median is shown as center line within the box. Post-hoc testing was only performed on TNF-α, where a significant ANOVA main effect (p < 0.05) was observed. * indicates p < 0.05 compared to AATD + AUG, ‡ p = 0.0516 compared to AATD + AUG.