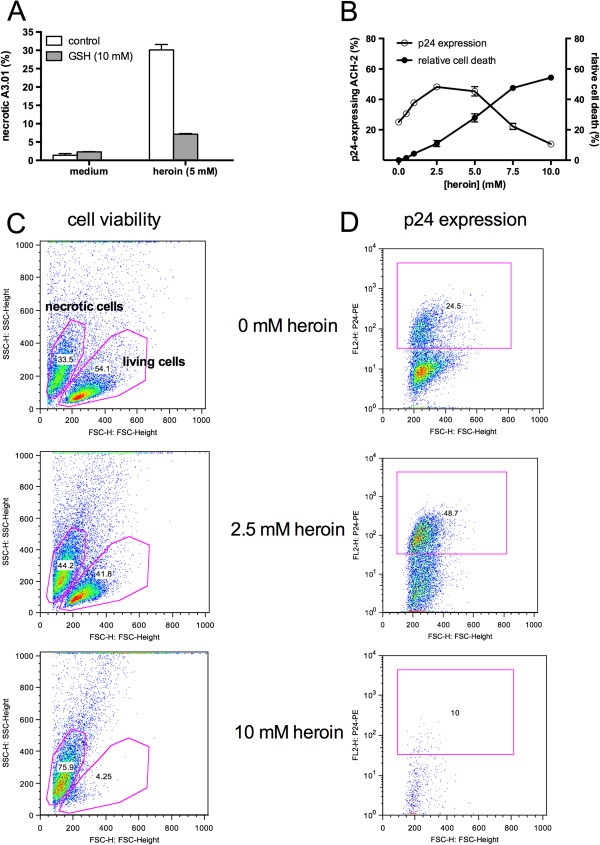
Figure 3.

Opioid-mediated reactivation of HIV is tightly linked to cellular necrosis. Latently-HIV-infected ACH-2 T lymphoblasts were cultured for 24 hours with of heroin in the presence or absence of glutathione. HIV replication was quantified by intracellular staining of HIV p24-antigen and flow cytometry (A). Cell viability was assessed by FSC/SSC-analysis in flow cytometry (B). Representative dot plots of cell viability analysis (C) and p24-expression (D) at different heroin concentrations. Pink rectangles on the right represent the gates for p24-positive cells and the small numbers within indicate the proportion (%) of p24-positive cells from the total number of events. Pink regions on the left represent the gates for living and necrotic cells and the small numbers within indicate the proportion (%) of events within the region from the total number of events.
