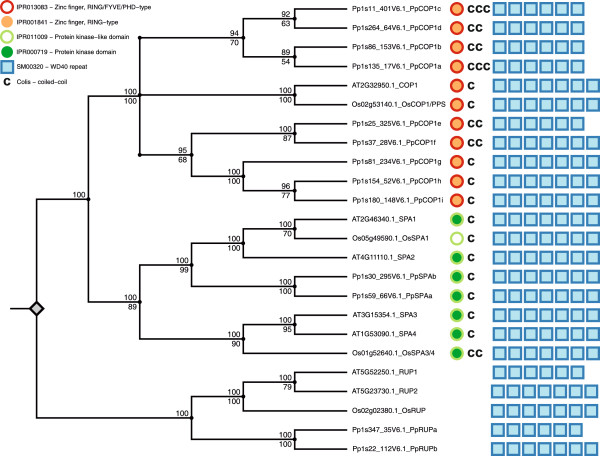
Figure 1.

Cladogram representing the COP1 and SPA gene family phylogeny in Arabidopsis, rice and Physcomitrella and overview of their protein domain structure. The cladogram combines the phylogenetic relationships between the species analyzed which were obtained by Bayesian inference and maximum likelihood. Branch lengths are not in proportion to evolutionary times. Grey diamond represents root of the phylogeny set by the RUP gene family as an outgroup. Numbers on internal branches indicate Bayesian inference prosterior probabilities (support values) in percent (upper number) or maximum likeliood bootstrap support values in percent (lower number). Next to each protein name obtained by the used sequence databases an alias was attached. Protein domains important for COP1 and SPA gene function obtained by InterProScan5 were plotted next to each protein; red rings, IPR013083 - Zinc finger, RING/FYVE/PHD - type; orange circles, IPR001841 - Zinc finger, RING - type; light green rings, IPR011009 - Protein kinase - like domain; green circles, IPR000719 - Protein kinase domain; blue boxes represent number of WD40 repeats, SM00320 - WD40 repeat; “c” symbols represent number of coiled-coil occurrence based on Coils prediction. Detailed settings used for tree construction and tree plotting can be obtained from the methods chapter.
