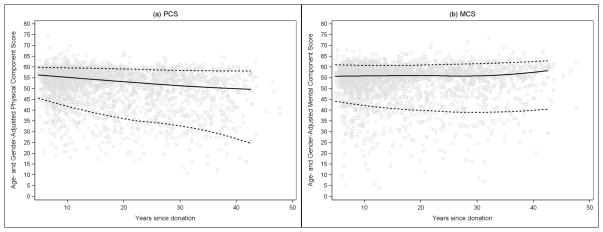
Figure 4. Sex- and age-adjusted PCS and MCS scores of RELIVE donors by time from donor surgery.
Each donor’s sex- and age-adjusted physical and mental component summary score is plotted by time from donor surgery in years in this scatterplot. Data points above the norm mean (50) on the y-axis indicate donors with better health and functioning than peers of the same age and sex. The solid line is a loess curve fitted to the observed median score and the dotted lines follow the 5th and 95th percentiles at each point in time. The overall adjusted physical and mental component mean scores are 54±9 (range 13 to 78) and 52±9 (range 3 to 71), respectively.

