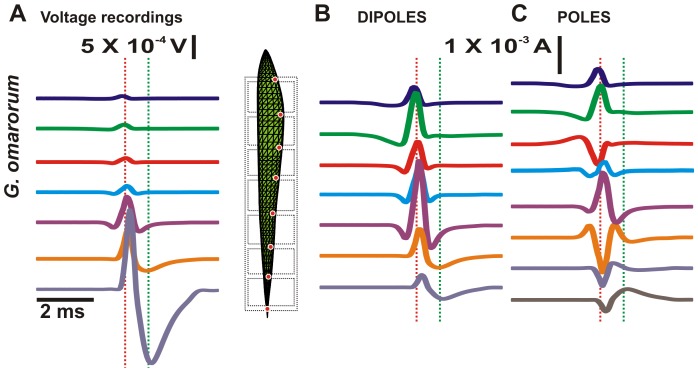
Figure 1. Voltages, dipoles and poles for G. omarorum.
(A) Recorded potential differences through the air gaps. (B) Rostral poles of the dipoles calculated from the recorded potentials, fish resistivity and fish morphology. The diagram between A and B represents the fish in the multiple air gap. Red dots represent the position of the poles in the model. (C) Poles calculated from the dipoles as a function of time. The red and green dotted vertical lines represent the positive peak of the htEOD and the negative peak respectively.

