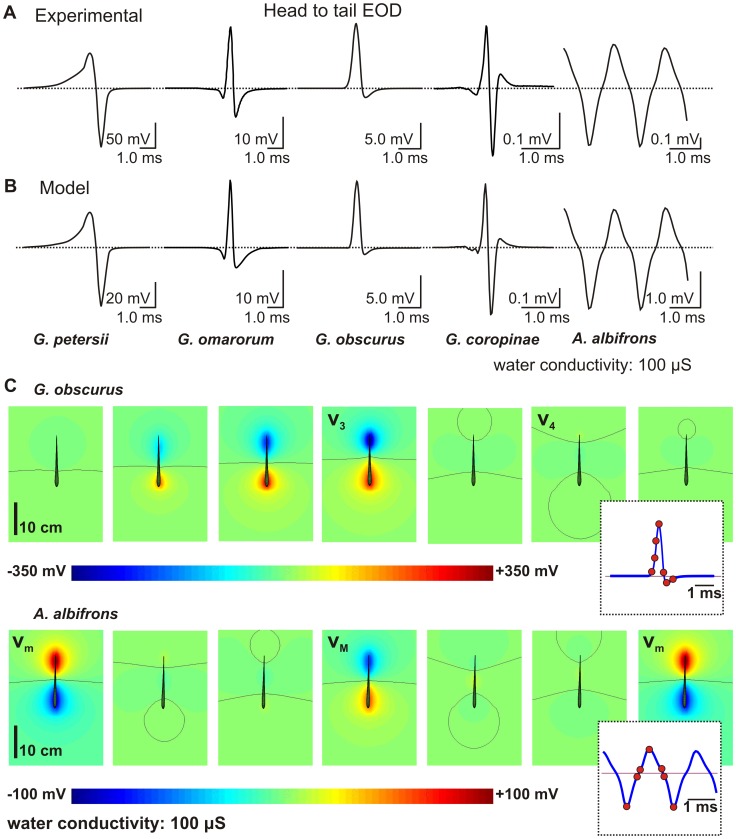
Figure 2. Head to tail EOD waveforms and electric potential in a horizontal plane.
(A) The experimental htEOD recording across the species (B). The htEOD recording calculated using the BEM model. Dotted line indicates zero voltage. (C) G. obscurus: three instants before the positive peak, the positive peak, an instant between the positive peak and the negative peak, the negative peak and one instant later. A. albifrons at the peak of the negative wave of the htEOD, two instants close to the zero crossing between the negative and positive peaks, at the peak of the positive wave, two instants close to the zero crossing between the positive and negative peaks and again at the peak of the negative wave. Black lines indicate the points where the potential is zero. The insets show the htEOD waveform at the selected instants (red dots).

