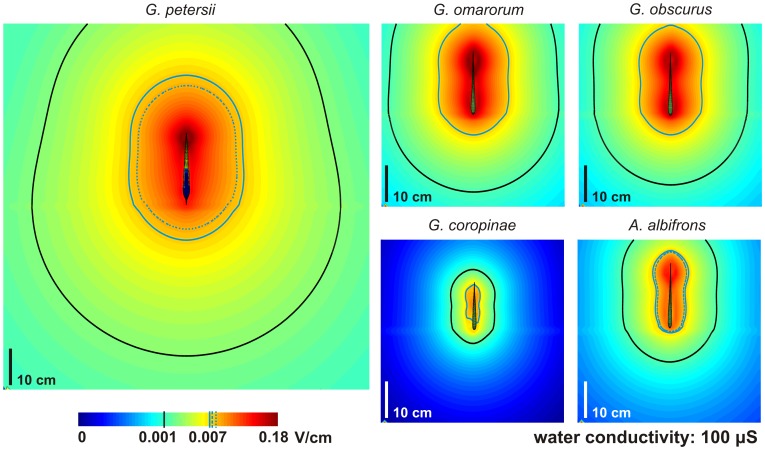
Figure 4. Comparison of maximum fields along the EOD.
The color maps represent the maximum absolute value of the field at each point of space computed for the whole time course of the EOD. Purple lines show the experimentally obtained thresholds for active electrolocation for G. omarorum (continuous line); G. petersii (dotted line); and A. albifrons (dashed line). For the sake of comparison, in every fish we plot (continuous lines) the threshold values of active (in sky-blue) and passive (in black) electroreception, corresponding to those experimentally determined for G. omarorum (values taken from [46], [47], [48], [49], [51]).

