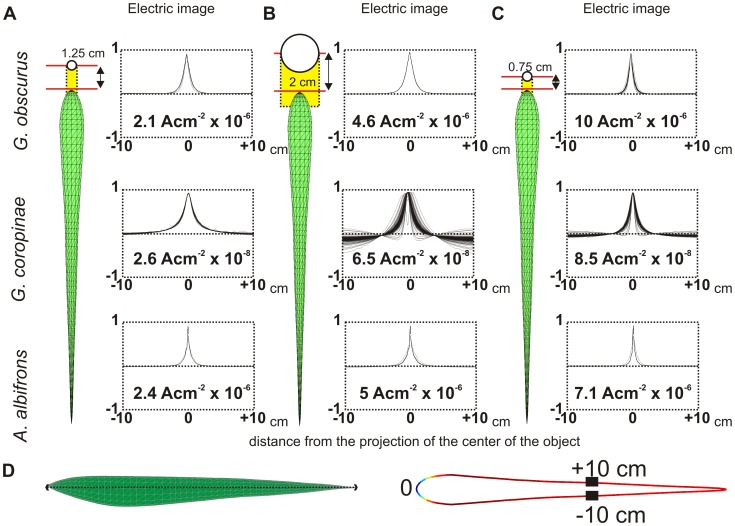
Figure 6. Image profiles for spheres of different size facing the fovea.
Amplitude image profiles for G. obscurus, G. coropinae and A. albifrons when (A) a small (0.25 cm radius) and (B) a large sphere (1 cm radius) face the fovea at when the distance between the skin and the surface of the sphere is 1 cm) and (C) when the small sphere faces the fovea at a shorter distance (0.5 cm). The plot shows the profile for the entire EOD normalized by the absolute maximum of each peak. The yellow area indicates the projection of the object on the skin. Note the different shapes for G. coropinae. (D) Schematic representation of the localization of the skin section in a lateral view (left) and seen from above (right), for G. obscurus. See Figure S3 for the complete image.

