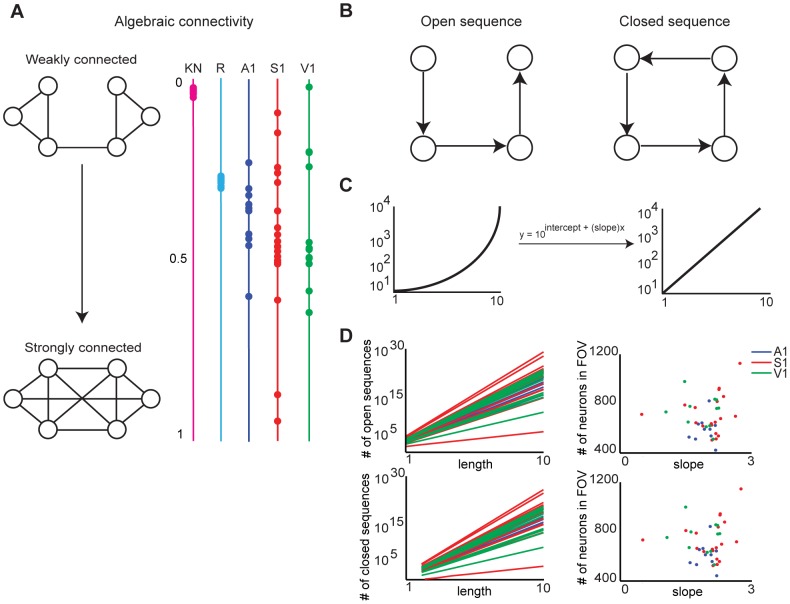
Figure 4. Functional topologies are connected and their size is independent of the number of neurons sampled.
A) Algebraic connectivity (normalized by number of nodes in the graph) of functional topologies in A1, S1, and V1. An algebraic connectivity closer to 0 indicates a weakly connected graph, whereas an algebraic connectivity closer to 1 indicates a strongly connected graph. B) Sequences are walks on adjacent nodes. Open sequences start and end on different nodes, while closed sequences start and end on the same node. C) Linearization of exponential plots by plotting y-axis values in log-scale. D) Left column: Linearized plot of number of open and closed sequences of given lengths in functional topologies generated from data in A1, S1, and V1. Right column: Scatter plots of slopes of growth curves on left column vs. the number of neurons in the corresponding fields of view.

