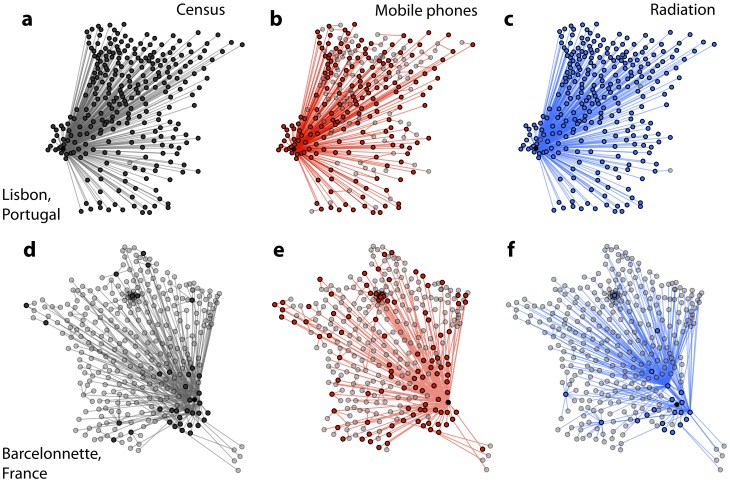
Figure 6. Epidemic invasion trees.
The full invasion trees for  are shown for Portugal (top row) and France (bottom row) in the cases of the census network (a, d), the mobile phone network (b, e) and the radiation network (c, f). Seeds of the simulations (black nodes) are Lisbon for Portugal and Barcelonnette for France. Nodes belonging to the first shell of the tree, i.e. those directly infected from the seed are fully colored. Grey nodes have been infected by secondary infected nodes.

