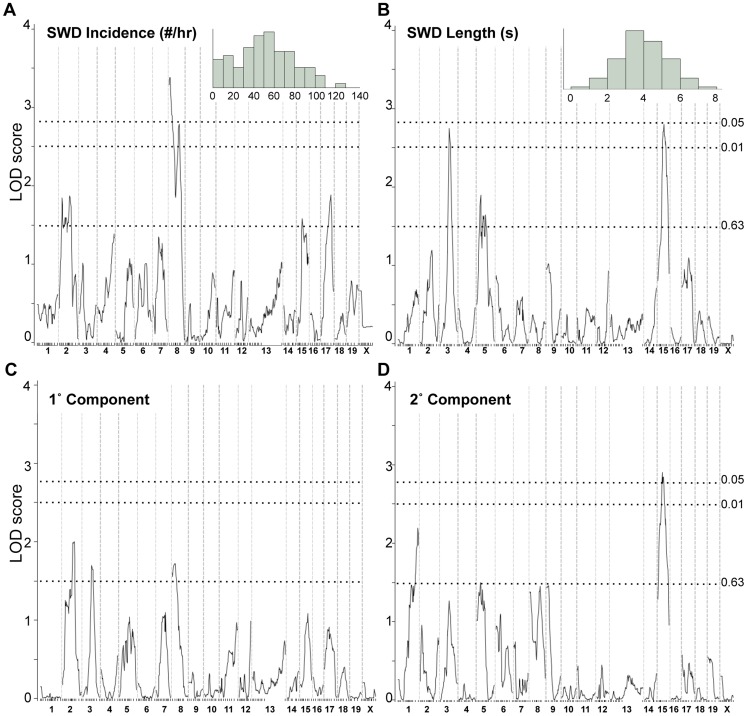
Figure 3. Genome scans for SWD traits in Gria4 deficient backcross mice.
Shown are genome-wide interval mapping LOD score plots from 89 backcross Gria4 mutant mice for two observed spike-wave discharge (SWD) traits - SWD incidence (panel A), SWD length (panel B) - and their first two principal components (panels C and D). The insets of panels A and B show the frequency distribution of the respective raw traits, although for interval mapping all four traits were first rank- and quartile-normalized prior to analysis. The chromosomes are shown at the bottom, with tick marks indicating positions of individual markers within each chromosome. Dotted lines show positions of genome-wide significance thresholds determined from 1000 permutations.

