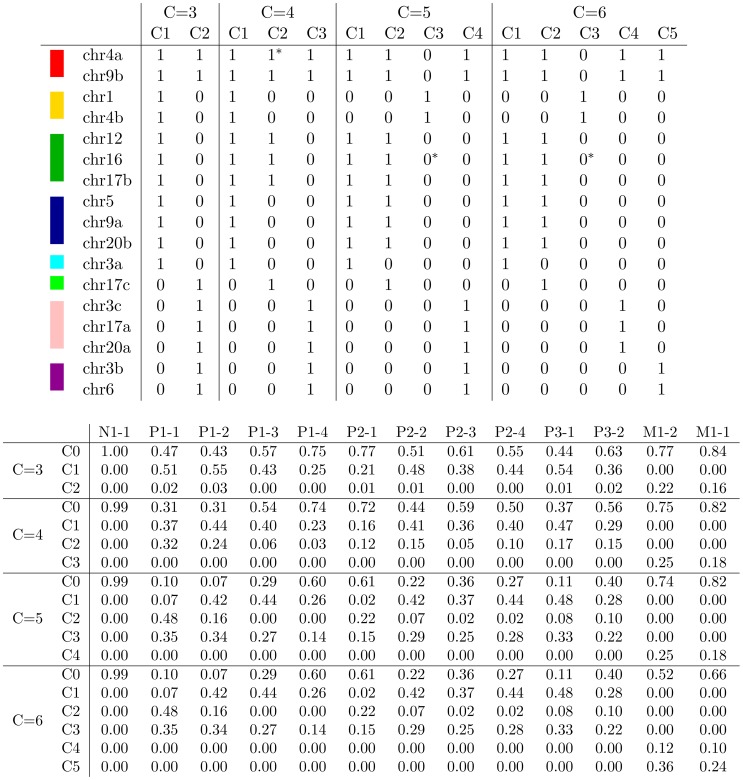
Figure 4. Inferred clonal genotypes and frequencies.
The top table lists, for each of the 17 loci, the inferred clonal genotypes using the EM procedure, assuming C = 3, 4, 5 and 6. In each case, the normal clone (C0) is omitted from the inferred matrix  , because its genotype consists entirely of zeroes by construction. For reference, each distinct genotype pattern per locus is assigned a unique color according to the scheme from Figure 6. In the table, bits with asterisks were flipped based on the phylogenetic analysis. The corresponding inferred clonal frequencies are listed in the bottom table, where each block shows a matrix
  for a value of
  , and C0 denotes the normal clone.

