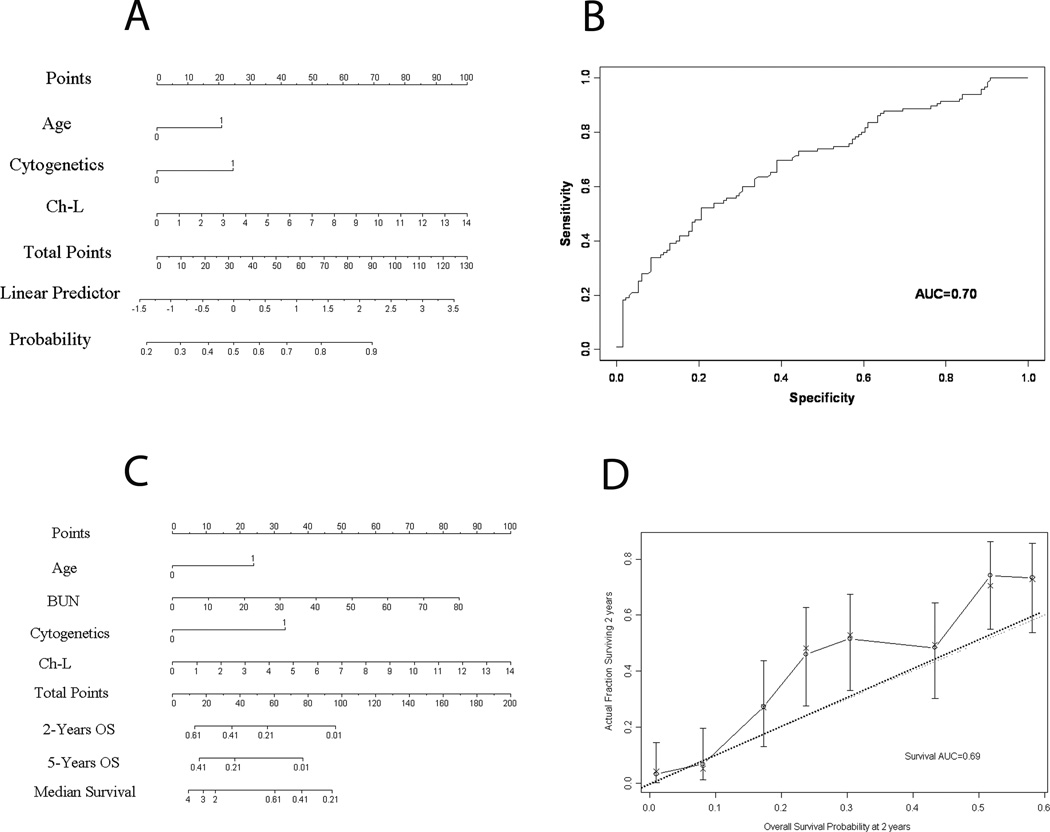
Figure 1. Estimating probability of non-response (Panels A and B) and survival (Panels C and D) in previously untreated patients with acute myeloid leukemia or and advanced myelodysplastic syndrome.
Panel A illustrates the nomogram for non-response, which is used by totaling the points identified on the top scale for each independent variable. The age is dichotomized as <70 (0 points). Cytogenetics are also dichotomized (24 points, unfavorable; 0 point, intermediate). Chymotrypsin-like proteasome activity is scored on a continuous scale. The total is then used to determine the estimated probability of non-response. Panel B shows the receiver operating characteristics (ROC) curve generated from 126 patients, in which nomogram-predicted outcomes were retrospectively compared with actual outcomes. Panel C shows the nomogram for survival. Interpretation is similar to that describe in Figure 1, but poor cytogenetics are scored as 33 and blood urea nitrogen levels are scored on a continuous scale. The probability of 2- and 5-year survival are shown. Panel D shows the calibration curve for 2-year survival based on a retrospective comparison of nomogram-predicted versus actual outcomes for 126 patients. Solid line represents performance of present nomogram with 95% confidence intervals; dashed line, actual survival of the patients.

