
Figure 4.
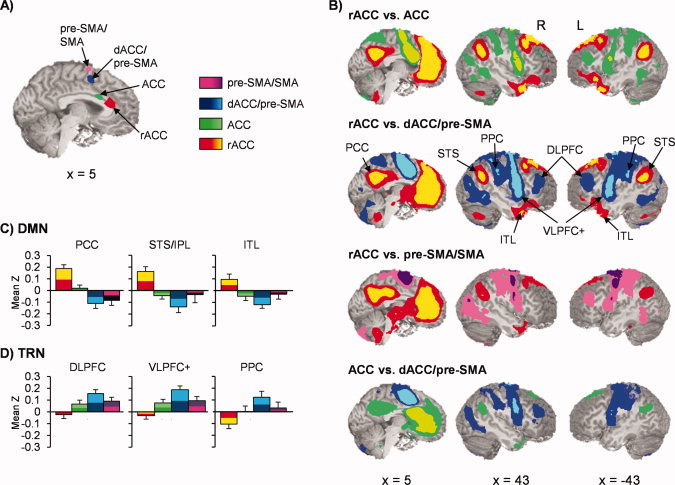
Panel A displays the location of the four clusters from the SIT versus SCT comparisons that were used as seeds in functional connectivity analyses. Panel B exhibits selected pairwise contrasts between the rostral anterior cingulate cortex (rACC; yellow/red), anterior cingulate cortex (ACC; green colors), dorsal anterior cingulate extending into the pre‐supplementary motor area (dACC/pre‐SMA; blue colors), and pre‐SMA/supplementary motor area proper (pre‐SMA/SMA; pink/purple colors). Clusters that survived false‐positive correction across pairwise comparisons were bichromatically color‐coded to be consistent with seed color scheme (i.e., increased connectivity for dACC/pre‐SMA represented with blue shades for all pair‐wise comparisons whereas increased connectivity with rACC color‐coded with yellow and red). Panel C demonstrates connectivity (mean Z score) between regions (PCC = posterior cingulate cortex; STS/IPL = superior temporal sulcus/inferior parietal lobule; ITL = inferior temporal lobule) of the default‐mode network (DMN) with the different seeds (error bars = 2 × standard error of the mean). Panel D shows a similar display for regions (DLPFC = dorsolateral prefrontal cortex; VLPFC+ = ventrolateral prefrontal cortex and anterior insula; PPC = posterior parietal cortex) of the task‐related network (TRN). Regions from both networks were defined based on the comparison of the rACC versus dACC/pre‐SMA (Panel B, second row). Locations of slices are given according to the Talairach atlas.