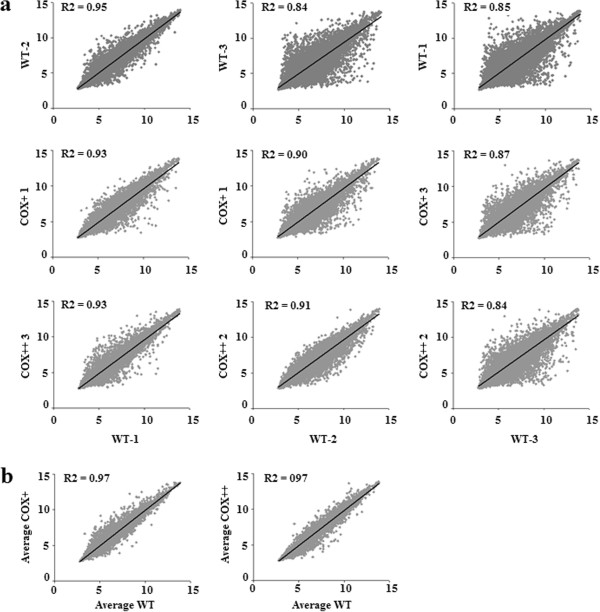
Figure 3.

XY scatter plots of transcriptome data. The correlation constant (R2) represents the variability of the global gene expression profile of two samples or groups. A small R2 indicates large variation, a large R2 indicates small variation. (a). XY scatter plots of the Col-3 replicates (WT) with each other (1st row) and with a replicate of COX + and COX++ with the smallest R2 value (2nd and 3rd row, respectively). (b). XY scatter plot for the averages of the groups.
