
Figure 4.
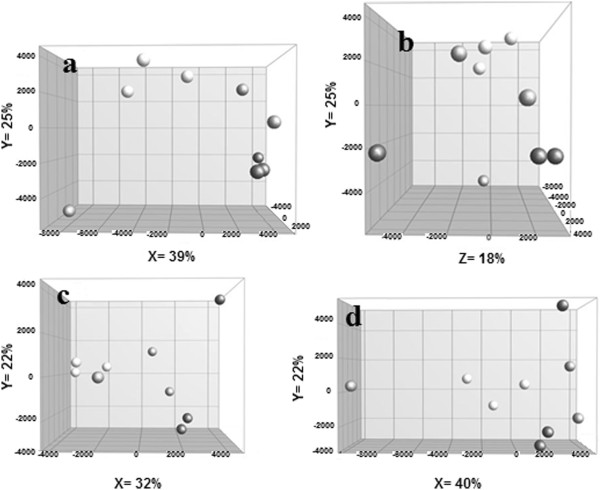
PCA plots using RMA normalized gene expression data of Col-3 plants and COX + and COX++ lines. a, PCA plot with PC1 (X) and PC2 (Y). b, PCA plot with PC3 (X) and PC2 (Y). c, PCA plot using genes with CV < 20% across wild type samples with PC1 (X) and PC2 (Y). d, PCA plot using ANOVA insignificant genes (α = 5%) with PC1 (X) and PC2 (Y). Percentages are the variation explained by the corresponding PC. Dark grey circles: wild type samples, light grey: COX + and black: COX++ samples.