
Figure 5.
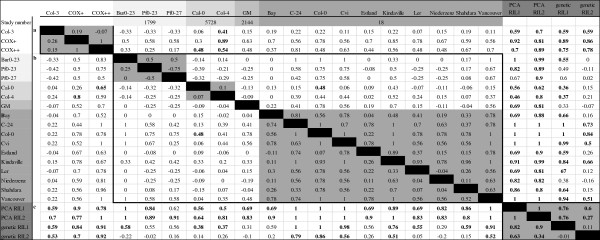
Transcriptome distances between Arabidopsis genotypes. Values above the diagonal are the distances based on intact (un-weighted) PC scores and values below the diagonal are distances based on the weighted scores on the first 9 PCs of a PCA on gene expression data of the wild type and transgenic lines of this study (a), wild type accessions of public databases (b) and groups of the Cvi/Ler RIL population (c). Significant values are shown in bold (permutation test, P-value = <0.05). a, b and c correspond to the source of the data which is delimited by blocks. Accessions shaded by the same color belong to the same experiment.