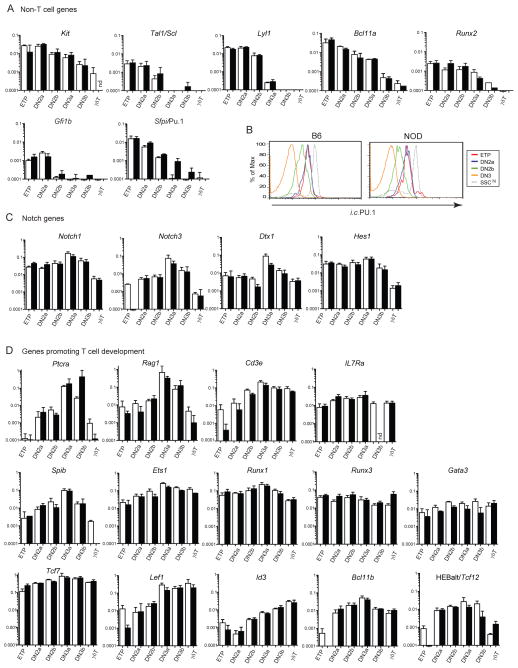
Figure 6. T lineage commitment precedes major changes in expression of genes related to Notch signaling and early T cell development.
(A, C, D) Quantitative RT-PCR results showing relative expression levels of T and non-T cell genes in ETP, DN2a, DN2b, DN3a cells, plus DN3b (β-selected T cells), and γδT cells for comparison, sorted from B6 (black bars) and NOD (white bars) mice. Values for each sample were calculated relative to Actb controls and presented as mean ± SE, n=2–5, nd = not determined. Graphs show the relative expression of non-T cell genes (A), Notch and related genes (C), and T lineage identity and required transcription factor genes (D). NOD ETP populations analyzed here are likely to include a small percentage of more mature T cells, which is made apparent by the use of a log scale. (B) Intracellular PU.1 in ETP, DN2a, DN2b and DN3a cell populations from B6 and NOD mice. Large granular cells (SSChi) included for positive controls (gray dashed line). Data are representative of 3 independent experiments.

