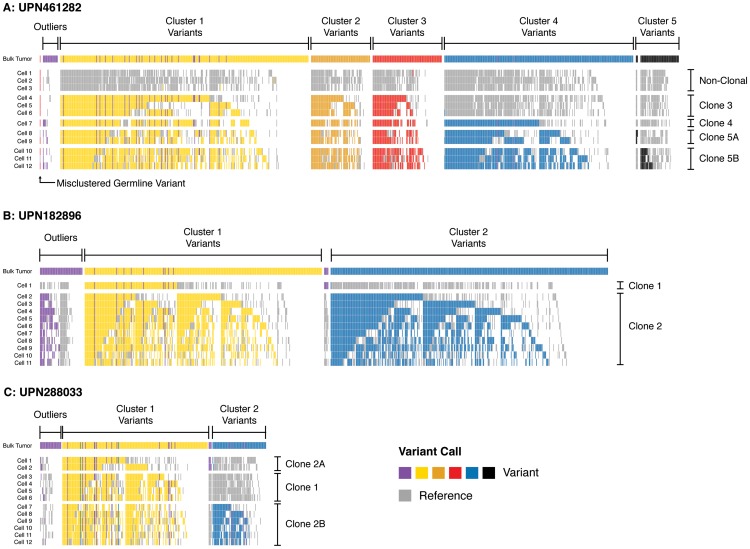
Figure 4. Single-cell mutation profiles.
Variant profiles across targeted somatic mutations in single-cell samples (sAML bone marrow) in (A) UPN461282, (B) UPN182896, and (C) UPN288033. Rows display positive and negative variant calls color-coded by mutation cluster for each single-cell sample, and columns indicate specific SNVs somatic at sAML diagnosis. Variants are grouped and color-coded by cluster as predicted from sequencing unfractionated material (uppermost track in each panel). Each cell is grouped by the clone it is inferred to represent. Outlier SNVs (purple) were those which could not be confidently clustered based on bulk sequencing. Here, many of these are merged into predicted clusters based upon their presence/absence in single-cell libraries (i.e., harboring the same pattern as well-defined clones). Positions where reference calls were made are colored grey; positions where no call was made (<25× coverage) are colored white. Pairs of variants that always travel in the same state (reference or variant) likely arose in the same clonal expansion. Pairs of variants that are called together in some cells but not others are likely related by linear evolution. Pairs of variants that are mutually exclusive suggest evolutionary branch points, and were rare. This suggested that variants in subclone 5 in UPN461282 (A), and subclone 1 in UPN288033 (C) were divided among additional subclones (now 5A/5B, 2A/2B). See Figure S7 for data presentation with unmodified clone and cluster definitions (derived from bulk sequencing).

