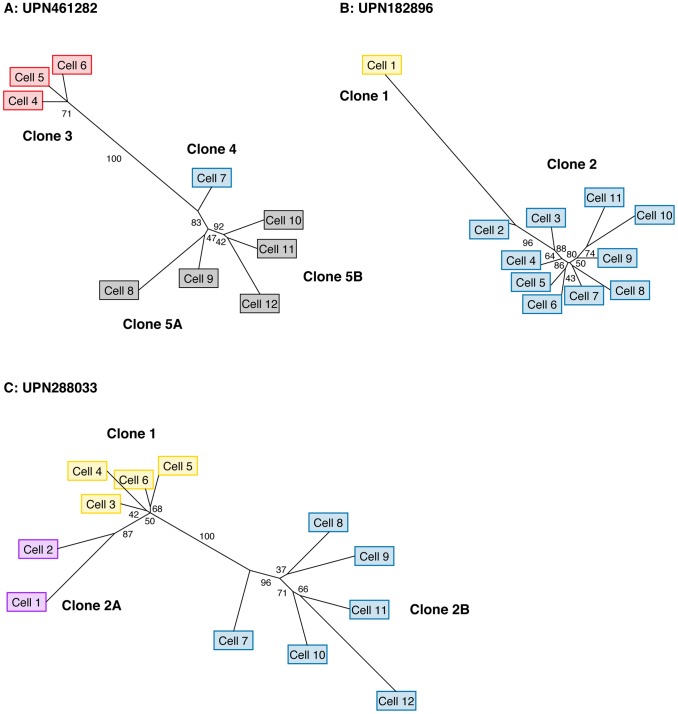
Figure 5. Single-cell reconstruction of tumor phylogeny.
Maximum likelihood phylogenetic trees derived from single-cell genotypes at targeted somatic SNVs. (A) UPN461282 (B) UPN182896 (C) UPN288033. Values along edges represent branch support determined by non-parametric bootstrap (n = 1000 iterations). Edges with ≥75% support are considered strongly supported. Cell labels are identical to those in Figure 4 , and colored based on the presence variant clusters corresponding to the profiles detailed in Figure 4 .

