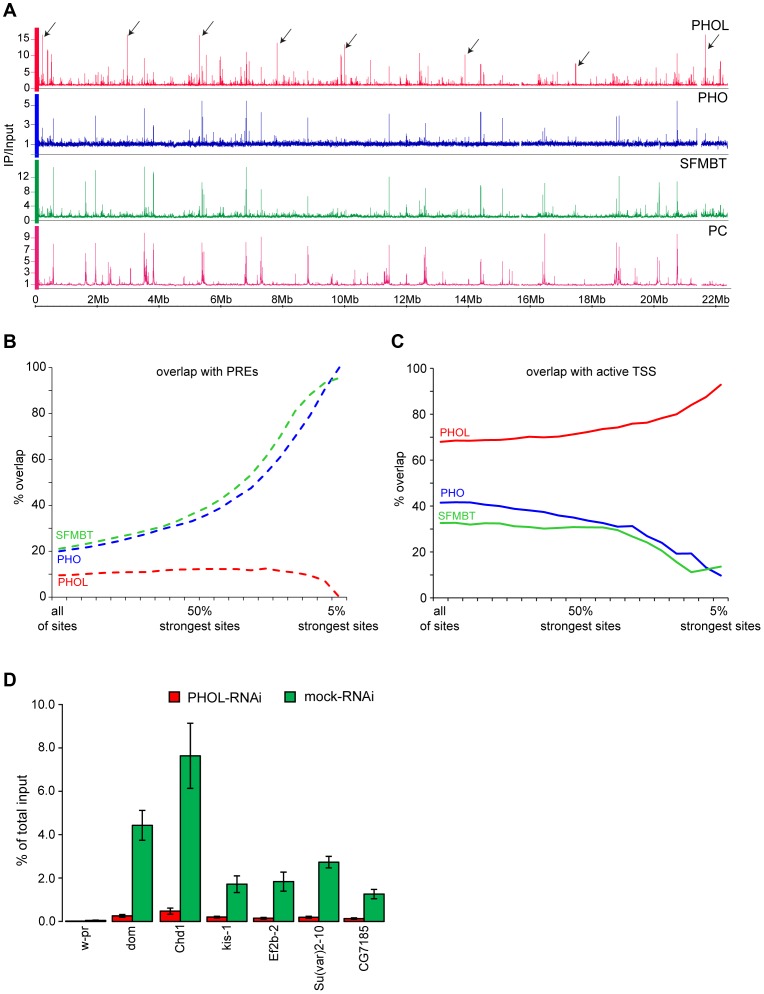
Figure 1. PHO is more tightly linked to SFMBT and PcG repression than PHOL.
A. The distributions of PHOL (red), PHO (blue) SFMBT (green) and Polycomb (PC, purple) are plotted along the left arm of Chromosome 2. The strongest PHO and SFMBT sites coincide with each other and with PC while the strongest PHOL sites, some of which are marked with black arrows, are outside of PC- regulated genes. B. The % overlap of PHOL, PHO and SFMBT binding sites with PREs was plotted as the weaker binding sites were progressively removed from the data sets. C. Plotted as in (B) the % overlap of PHOL, PHO and SFMBT binding sites with regions +/− 300 bp around active TSSs. Note that the strongest PHO and dSFMBT binding sites are at PREs while the strongest PHOL sites are at active TSS. PREs (total 201) were taken from [23]. The active TSSs (total 7946) were defined based on RNA-sequencing data from Cherbas et al. [32] and a threshold of 300 reads per kb of exon model (RPKM). D. The sharp drop in PHOL ChIP signal after PHOL RNAi at a set of TSS-proximal sites (indicated below the x-axis) indicates that they represent a class of genuine PHOL binding sites. The w-pr amplicon corresponds to the promoter of the white gene and serves as a negative control. The ChIP yields are expressed as fractions of total input material present in the reactions. Here and below the mean of two to three independent experiments and the standard deviation (error bars) are shown.

