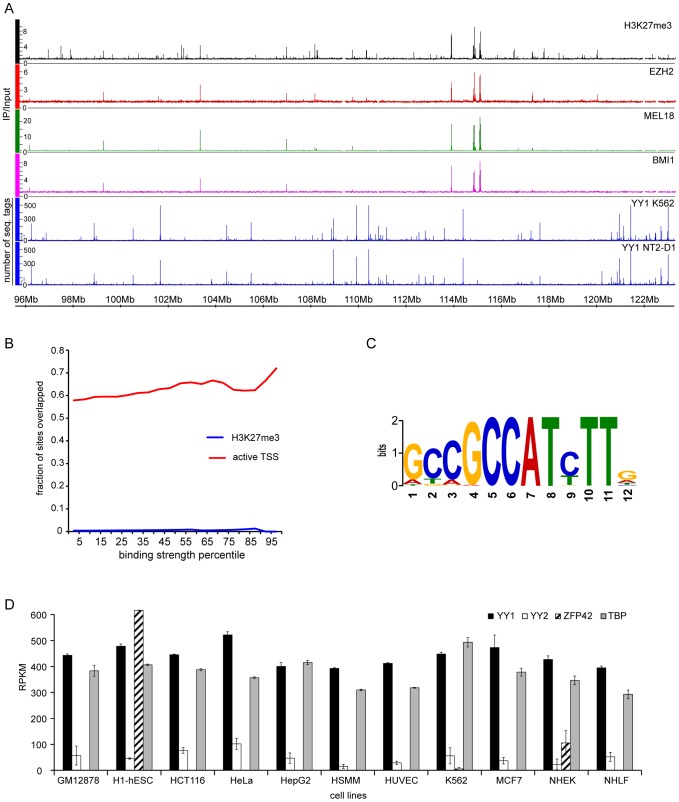
Figure 7. YY1 is not involved in Polycomb silencing in human cells.
A. The distributions of H3K27me3 (black), EZH2 (red), MEL18 (green) BMI1 (purple) in NT2-D1 cells and the distributions of YY1 in NT2-D1 and K562 cells (blue) are plotted along the 26 Mb segment of Chromosome 12. The strong binding sites for EZH2, MEL18, BMI1 and H3K27me3 coincide and show no overlap with YY1. Note that the distribution of YY1 in NT2-D1 and K562 cells is essentially identical. B. The extents of YY1 overlap with H3K27me3 enriched regions (blue line) or regions +/− 700 bp around active TSS (solid lines) in NT2-D1 cells are plotted as function of YY1 binding signal. There is virtually no overlap between YY1 and H3K27me3. The overlap-plots for MEL18, BMI1 and EZH2 are not shown since these have zero values for every bin. The active TSSs were defined based on RNA-sequencing data from ENCODE and the threshold of 300 RPKM. C. The logo representation of a sequence motif revealed by the analysis of the DNA underneath YY1 binding sites detected by all three antibodies in NT2-D1 cells. D. The expression of YY1 (black bars), YY2 (white bars), Zfp42 (shaded bars) and “housekeeping” TBP (grey bars) genes derived from RNA-seq data indicate that YY2 and ZFP42 proteins are not available in most of the cell types listed below the x-axis. The average RPKM values between two independent experiments are plotted with error bars indicating the scatter.

