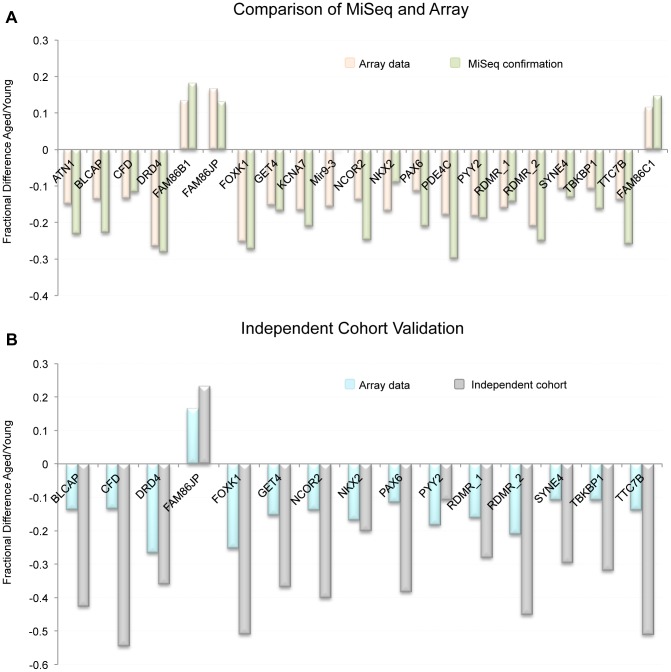
Figure 4. (A) Comparison of MiSeq results to our array results at 21 representative regions.
Because beta-values and fraction methylation are generated in a different manner (array vs. sequencing respectively) they are not directly comparable. For this reason we compared the fractional difference for each loci and each technology. This is accomplished by the following equation: fractional difference = (aged value/young value)−1. (B) the fractional difference between young and aged samples at 15 selected loci as measured by array in the 17 donor samples as well as in the independent cohort (19 samples from individuals > = 45 years of age and 47 samples from individuals <25 years of age taken from the general population). On average the fractional difference identified in the independent cohort (as measured by sequencing) was approximately 2.2 times greater in magnitude than was identified in the 17 donors.

