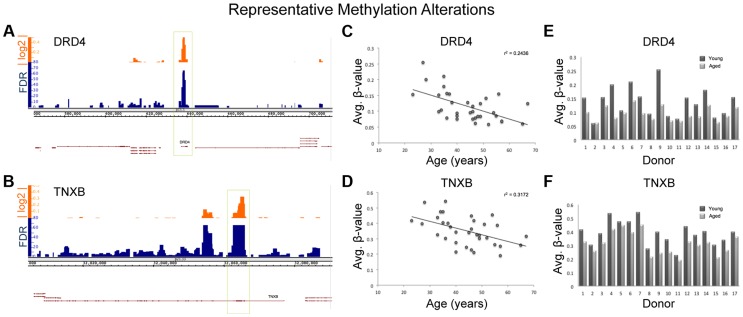
Figure 7. Various descriptive statistics are presented for both TNXB and DRD4; 2 regions of representative methylation alterations.
(A,B) The alignment track for each gene is displayed in Integrated Genome Browser (IGB) with the associated false discovery rate (FDR) denoting the significance of the change and the absolute log 2 ratio reflecting the magnitude of the alteration. (C,D) Scatter plots for each sample from all 17 donors (a total of 34 samples with each donor represented twice) with linear regression lines and associated r2 values were generated. Regression analysis revealed a significant decrease in methylation with age at both DRD4 and TNXB (p = 0.0005 and p = 0.003 respectively). (E,F) The average methylation within each window (DRD4 and TNXB) was plotted for each paired sample set and is displayed for each donor.

