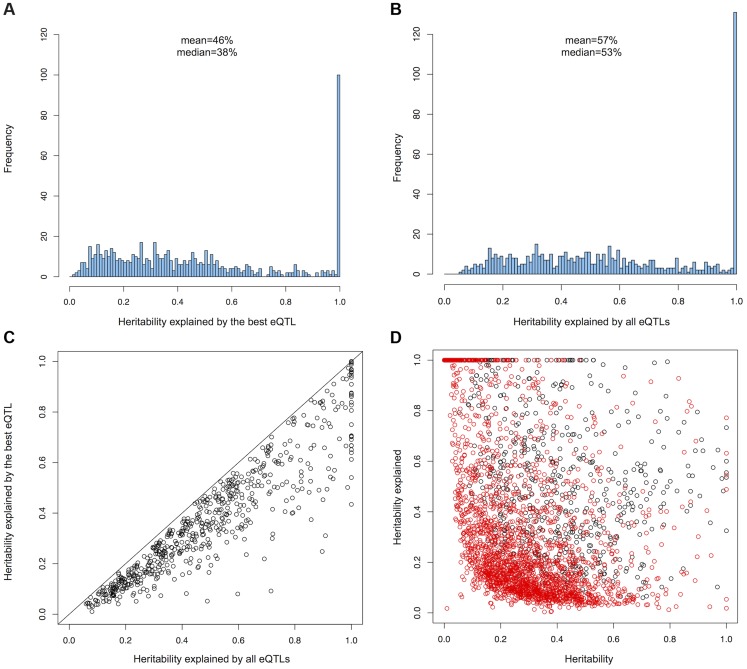
Figure 1.
(A) Histogram of heritability explained by the best cis-eQTL and (B) all independent cis-eQTLs for genes with more than one cis-eQTL. (C) Heritability explained by independent cis-eQTLs compared to the heritability explained by their best cis-eQTL for genes with more than one cis-eQTL. (D) Heritability of genes with one cis-eQTL (red) and more than one cis-eQTL (black) compared to heritabilty explained by all available eQTLs.

