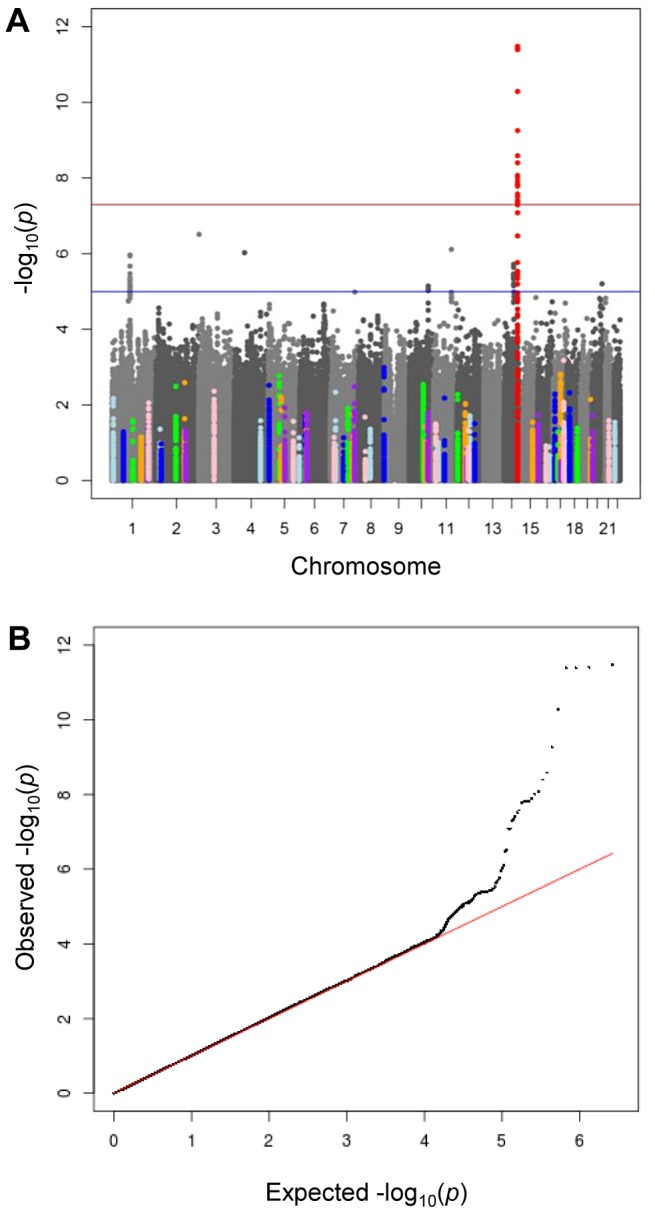
Figure 1. Meta-analysis of genome wide association studies for morning plasma cortisol.

A) Manhattan plot of −lop10 P values by chromosome. The red horizontal line indicates genome-wide significance (P<5×10⁻⁸) and the blue horizontal line indicates moderate significance (P<5×10⁻⁵). The lead SNP rs12589136 (chr14:94,793,686; b37) in red is genome-wide significant. SNPs within ±50 kb of cortisol-related candidate genes (listed in Table S6) are highlighted in colours. B) Quantile-quantile plot of −log10 P, comparing the distribution of observed −log10 P-values and that expected by chance.
