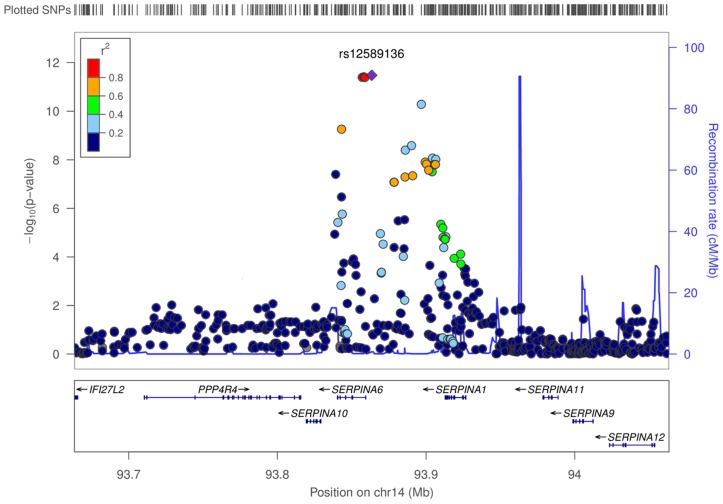
Figure 3. Regional associations surrounding lead SNP rs12589136 in genome-wide meta-analysis of morning plasma cortisol.
Regional plot shows −log10 P values of all SNPs, and degree of correlation between all SNPs and lead SNP rs12589136. SNPs with lower P values span SERPINA6 and SERPINA1 genes within a recombination boundary.

