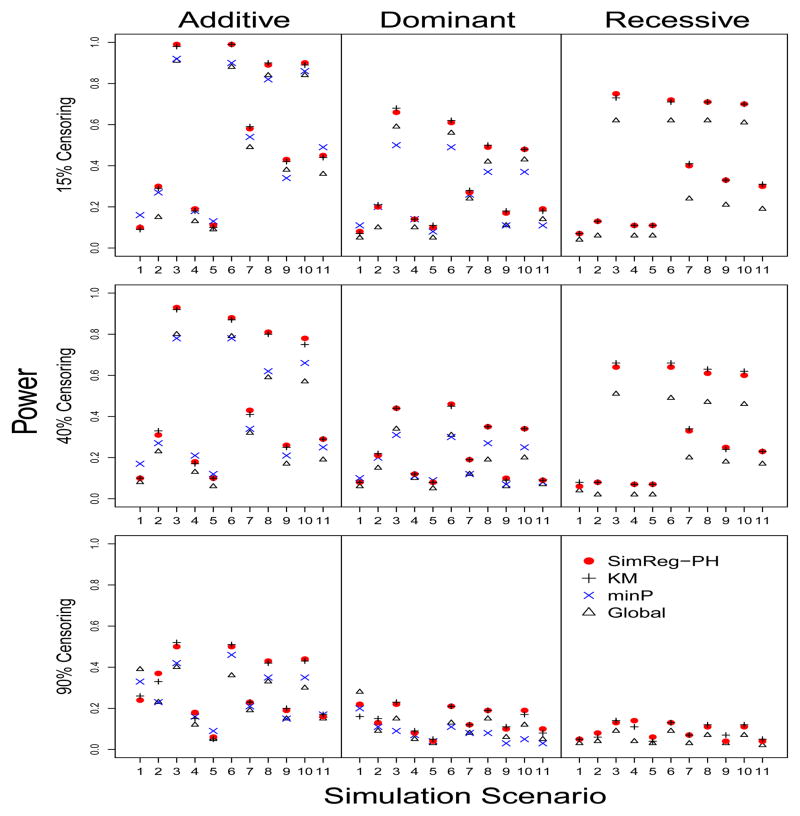
Figure 3. Power when the survival times are generated from the PH model.
The 11 scenarios are defined in Table 2. Each row shows the results under different censoring proportions, 15%, 40% and 90% from top down. The Y axis is the power. Powers were obtained based on 100 replications using different methods under a PH model assumption.

