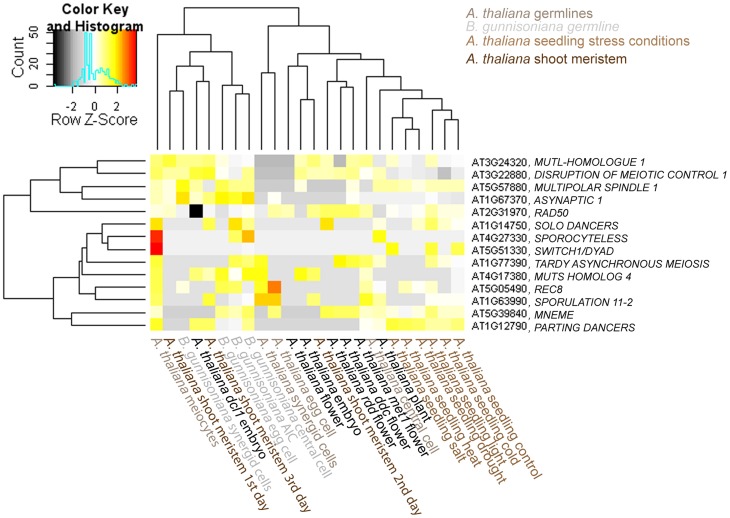
Figure 5. Heatmap of log2 transformed normalized read counts for 14 selected meiotic or MMC-expressed genes.
Hierachical clustering of read counts from different Arabidopsis and Boechera cell- and tissue types [13], [62]–[66]. The hierarchical clustering of samples and genes was based on euclidean distance and hierarchical agglomerative clustering. Colours are scaled per row. Red denotes high expression and black low expression.

