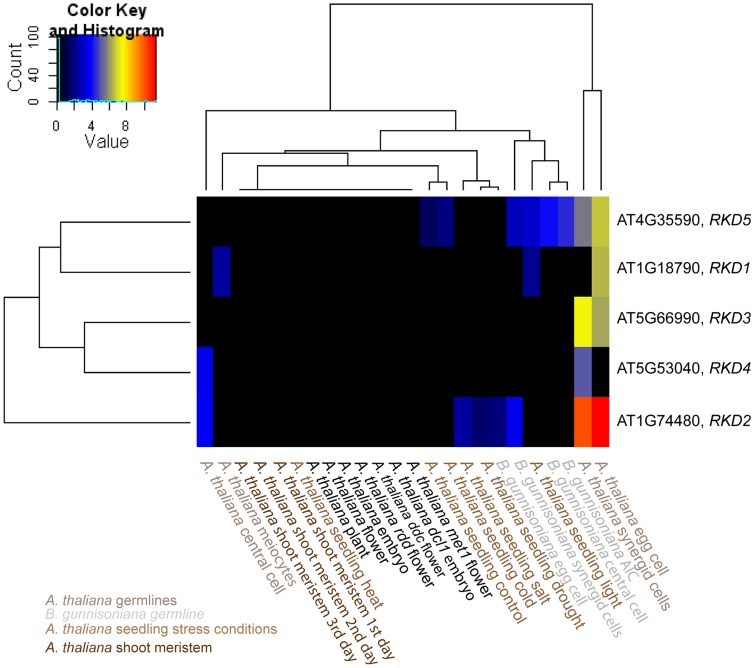
Figure 7. Heatmap clustering of members of the AtRKD gene family.
Heatmap of normalized log2 transformed read counts from different Arabidopsis and Boechera cell- and tissue-types [13], [62]–[66]. The hierarchical clustering of samples and genes was based on euclidean distance and hierarchical agglomerative clustering. No row scaling of colours was applied. Red denotes high expression and black low expression.

