
Figure 4.
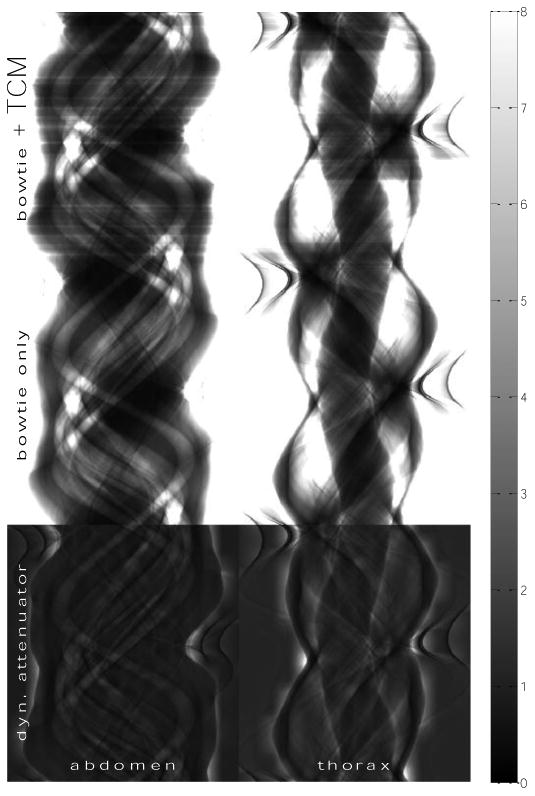
Matrix of sinograms of incident flux in 106 s-1 mm-2 for the (left column) abdomen and (right column) thorax datasets. The rows, from top to bottom, correspond to a reference system with both TCM and the bowtie filter, a reference system with only the bowtie filter, and the dynamic attenuator system. Values are reported in 106 s-1 mm-2, with the scale bar shown on the far right. Within each dataset (column), these sinograms produce reconstructed images with equal peak variance for the ideal detector. However, the dynamic attenuator suppresses the signal-rich regions in the sinogram, while increasing the flux in signal-poor regions to maintain image quality in the reconstructed image.