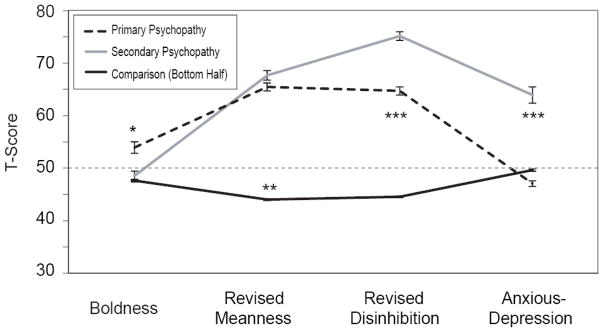
Figure 1.

Cluster variate profiles for psychopathy subtypes and the comparison group referenced to the overall base sample. The base sample (N = 4043) is scaled to have a mean of 50 and a standard deviation of 10. Primary Psychopathy = participants in the first cluster group (n = 110). Secondary Psychopathy = participants in the second cluster group (n = 83). Comparison (Bottom Half) = participants scoring at or below the 50th percentile on TriPM total scores (n = 1878). Error bars represent standard errors of the mean. * Primary Psychopathy group differs significantly (p<.001) from both Secondary Psychopathy and Comparison groups; ** Both Psychopathy groups differ significantly from Comparison group (p<.001), but not from one another (p > .05); *** All three groups differ significantly from one another (p<.001).
