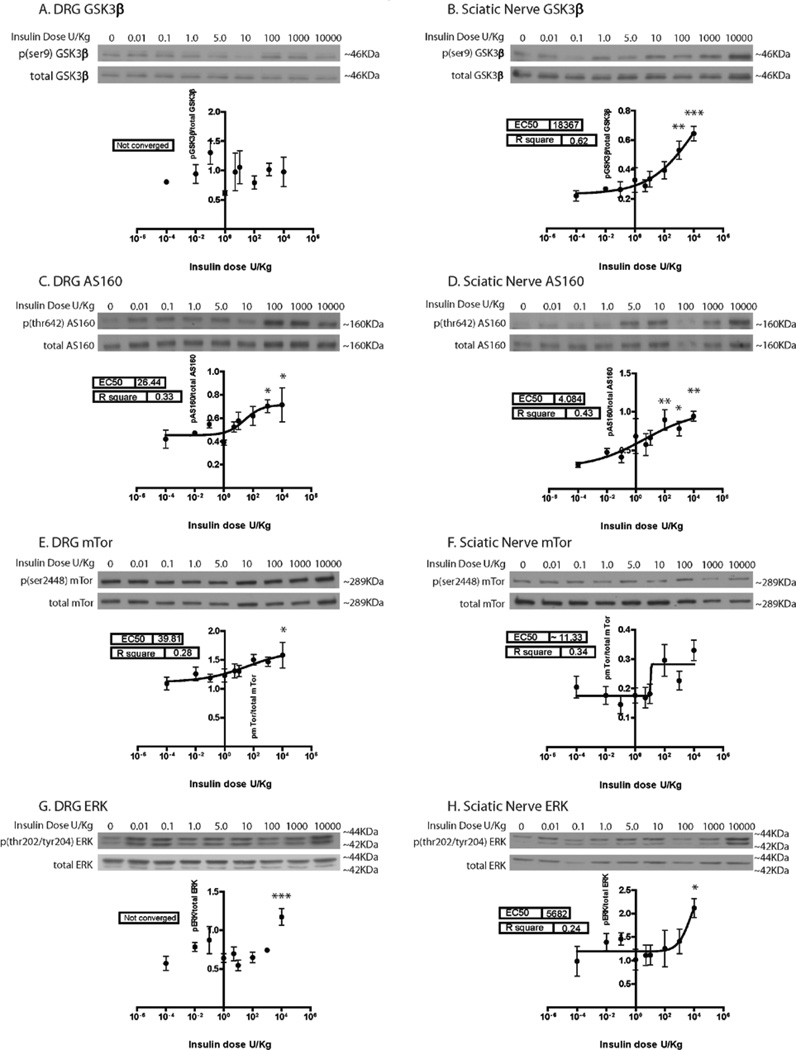
Figure 3. Insulin dose curve downstream mediator activation.
In addition to Akt, the in vivo signaling of several other proteins in the insulin pathway was investigated in the DRG and sciatic nerve in response to an IP insulin dose curve. Data was fit with a sigmoidal dose response curve and analyzed with a 1-way ANOVA and Dunnet’s post hoc. The sigmoidal dose response curve was unable to fit the GSK3β (A) and ERK (F) results in the DRG (not converged). All other proteins appear to have a dose dependent relationship with insulin. The overall ANOVA p-value was significant for all proteins investigated except mTor and GSK3β in the DRG and ERK in the SN. Results of Dunnett’s post hoc are denoted with *. n=4–5 mice per dose. *=p<0.05, **=p<0.01, ***=p<0.001.

