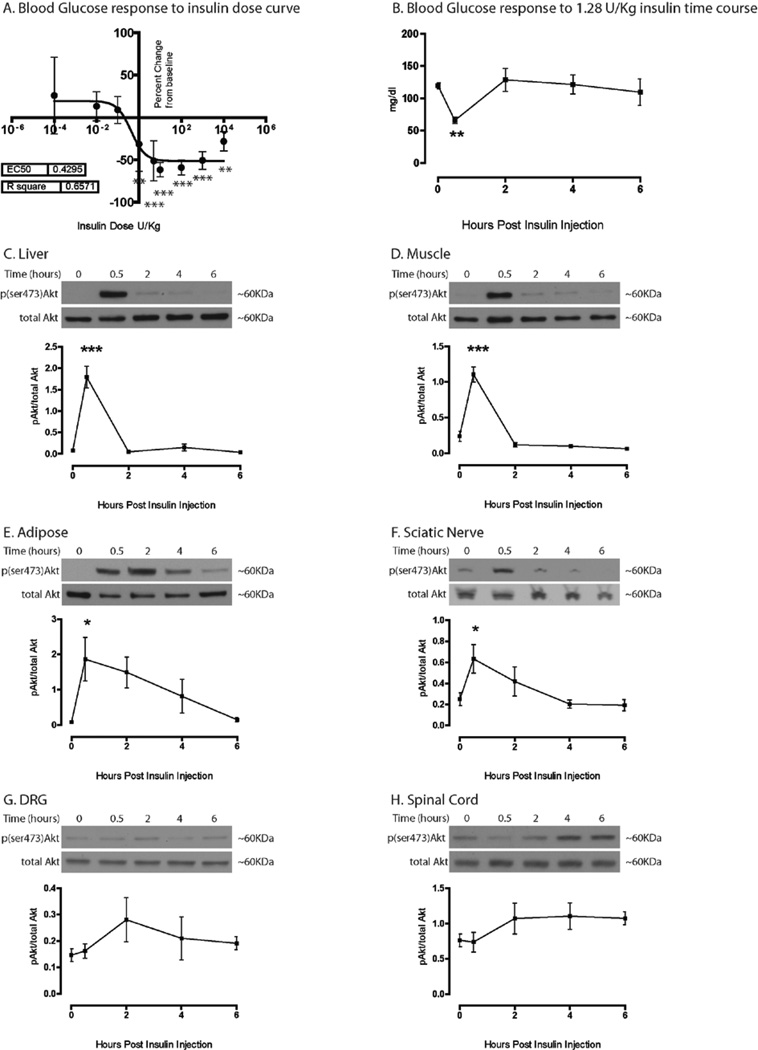
Figure 5. “Therapeutic” insulin dose Akt activation time course in liver, muscle, adipose, sciatic nerve, DRG, and spinal cord.
The EC50 for glucose percent change was 0.43 U/Kg in insulin dose curve studies (A). A 6-h time course study using 1.29 U/Kg insulin showed a significant decrease in glucose levels 30 min after insulin injection, with a return to baseline by 2 h (B). Significant Akt activation was observed at 30 min post insulin in the liver (C), muscle (D), adipose (E), and sciatic nerve (F). No significant changes were seen in the DRG (G) or lumbar spinal cord (H). Data was analyzed with a 1-way ANOVA and Dunnett’s post hoc. n=6 at 0 time point, n=6 at 30 min time point, n=4 at 2 h time point, n=5 at 4 h time point, n=3 at 6 h time point. *=p<0.05, **=p<0.01, ***=p<0.001.

