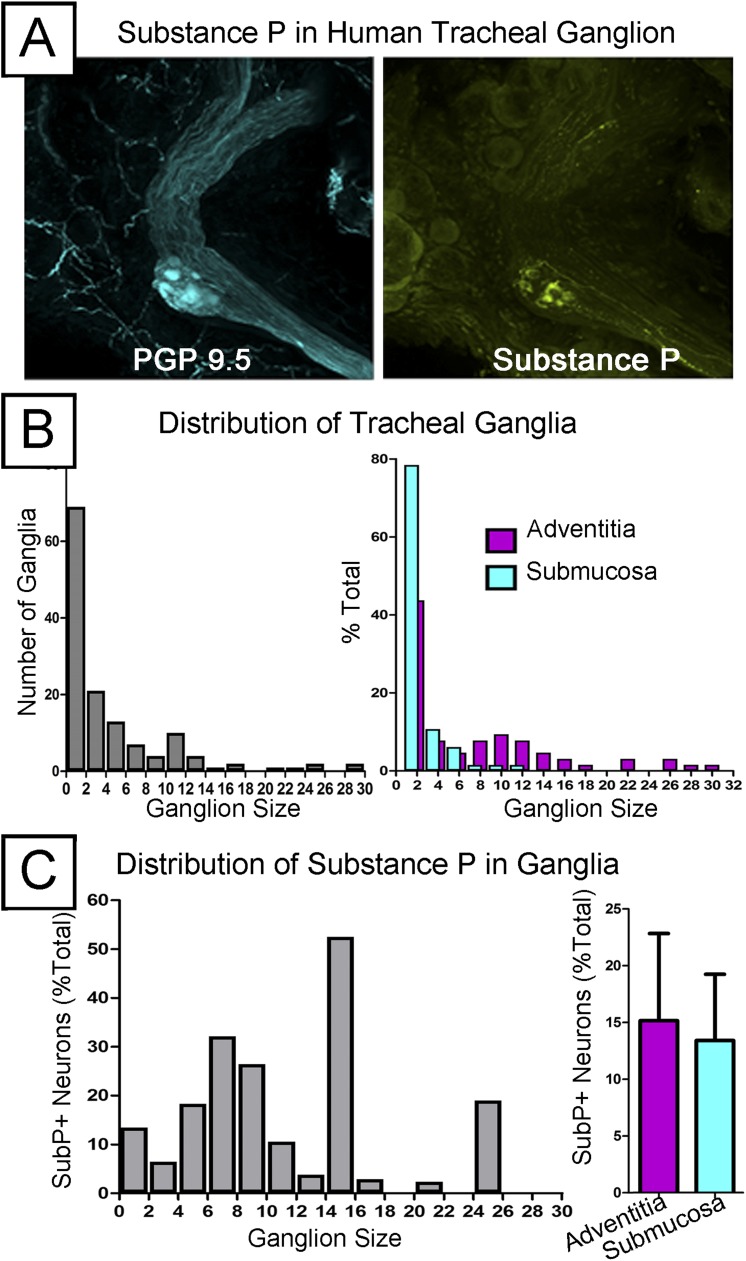
Figure 7.
Quantifying the distribution of human tracheal ganglia and the substance P subpopulation (n = 6). (A, left) Mid-sized intrinsic ganglia in human trachea stained with PGP 9.5. (A, right) Substance P was also labeled in these ganglia, where it stains neuron bodies and axons within the neighboring nerve bundle. (B, left) The relative abundance of different sized ganglia across the whole trachea and (right) their relative abundance when separated into submucosa and adventitia layers. (C) Quantification of the size distribution and overall layer separation in the substance P subpopulation.

