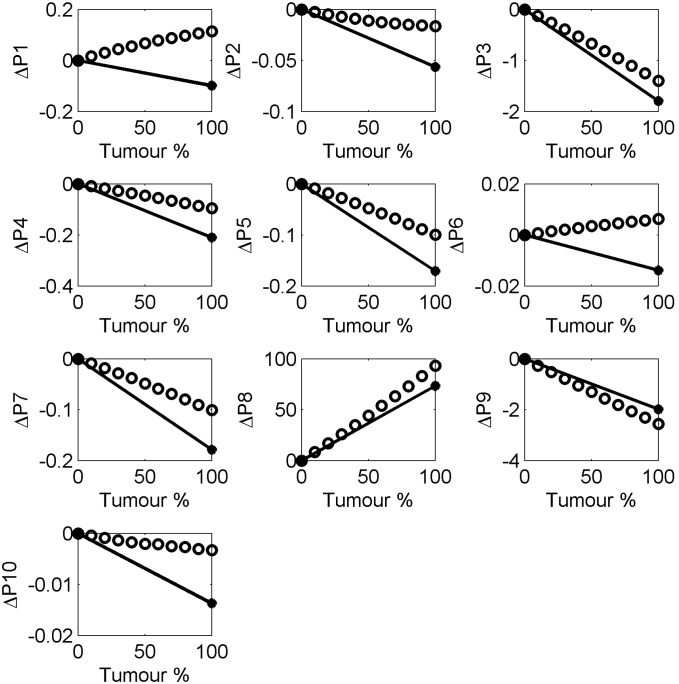
Figure 5. Change in the THz pulse parameter values as a function of the percentage of tumour.
The values for normal breast were used as the baseline and the changes in the parameters were calculated as a function of the proportion of tumour, showing measured breast tissue (black dots, black line) and FDTD simulated breast response (black open circles).

