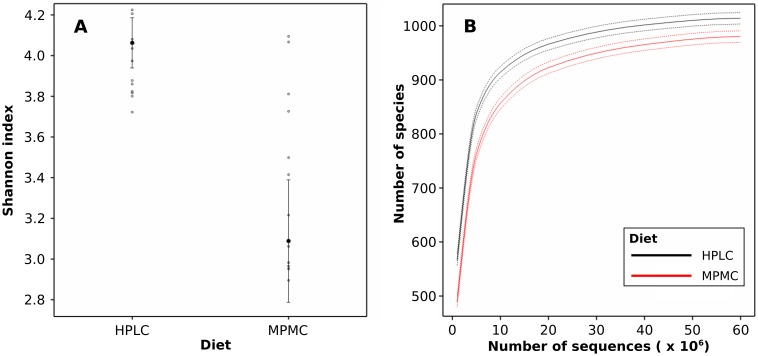
Figure 1. Species diversity and richness of feline fecal microbiomes by diet.
(a) Shannon diversity indices as inferred from normalized species counts. (b) Rarefaction analysis of species richness. Species diversity and richness was significantly higher (with p<0.001) in the high-protein low-carbohydrate (HPLC) microbiome compared to the moderate-protein moderate-carbohydrate (MPMC) microbiome.

