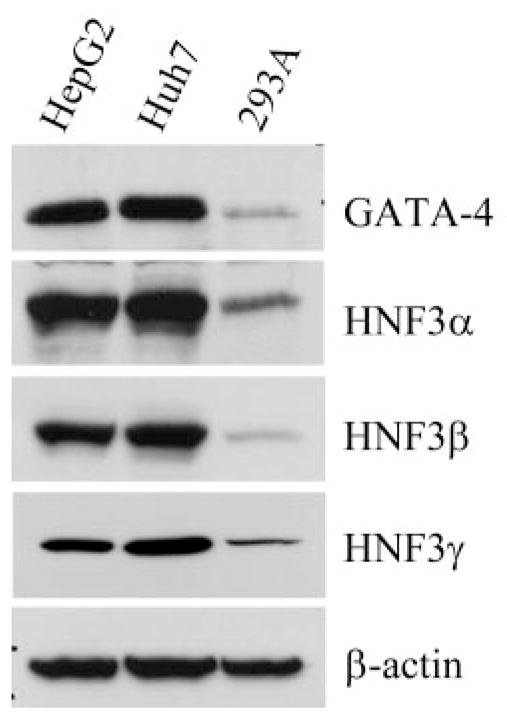
Fig. 9.

Comparison of GATA-4 and HNF3 protein amounts in hepatoma and nonhepatoma cells. GATA-4, HNF3α, HNF3β, and HNF3γ proteins in HepG2, Huh7, and 293A cells were analyzed by immunoblotting. The β-actin blot was shown as a reference for the equal loading of total proteins (40 μg) of the tested samples.
