
Figure 3.
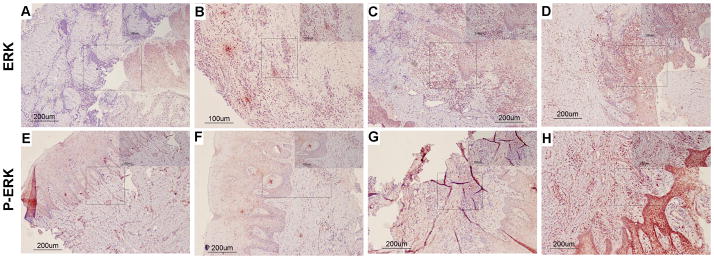
Total (A–D) and Phospho (E–H) ERK MAPK immunohistochemistry scoring. The left column (panels A, B, E, and F) illustrates a “0” score (no staining) of immunostained tissue samples. The right column (panels C, D, G, and H) illustrates a high/severe level of “3” immunostained tissue samples. “E” refers to epithelium and “CT” refers to connective tissue. Arrows indicate representative areas of the inflammatory infiltrate scored.