Figure 4.
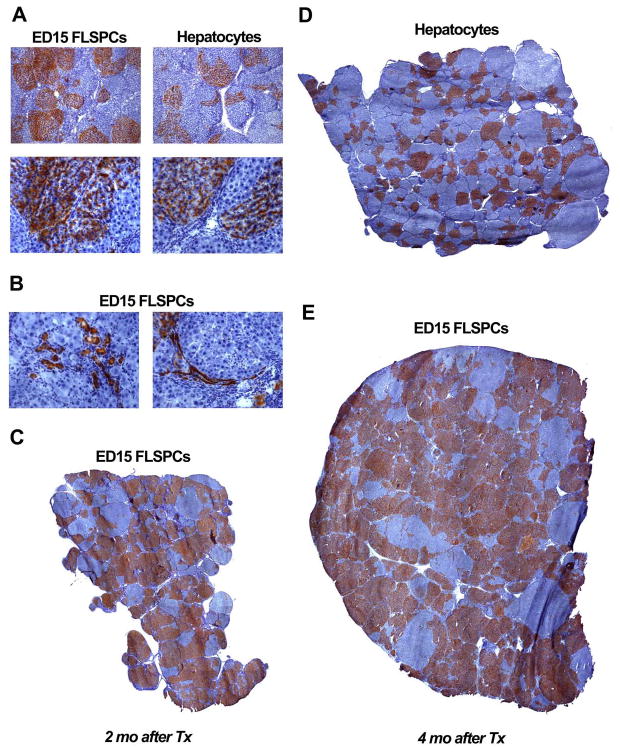
Repopulation of transplanted cells in host liver with progressing fibrosis/cirrhosis. Donor cells (~8 × 10⁷ fetal liver cells vs. ~2 × 10⁶ hepatocytes) were infused in conjunction with PH into rats at 3 months after starting TAA administration, which was continued at the same dose, thereafter (200 mg/kg, twice weekly). Liver repopulation was analyzed at 2 (A,B,C) and 4 months (D,E) after cell transplantation. ED15 FLSPCs differentiated into hepatocytes (A, lower left panel) and bile ducts (B). Original magnification, x50 (A, upper panels), x200 (A, lower panels; B). (C,D,E) Whole liver sections with the highest repopulation level observed at 2 and 4 months after cell transplantation are shown. Images contain 30, 41 or 64 merged adjacent microscopic fields (original magnification, x50) and can be zoomed in online.

