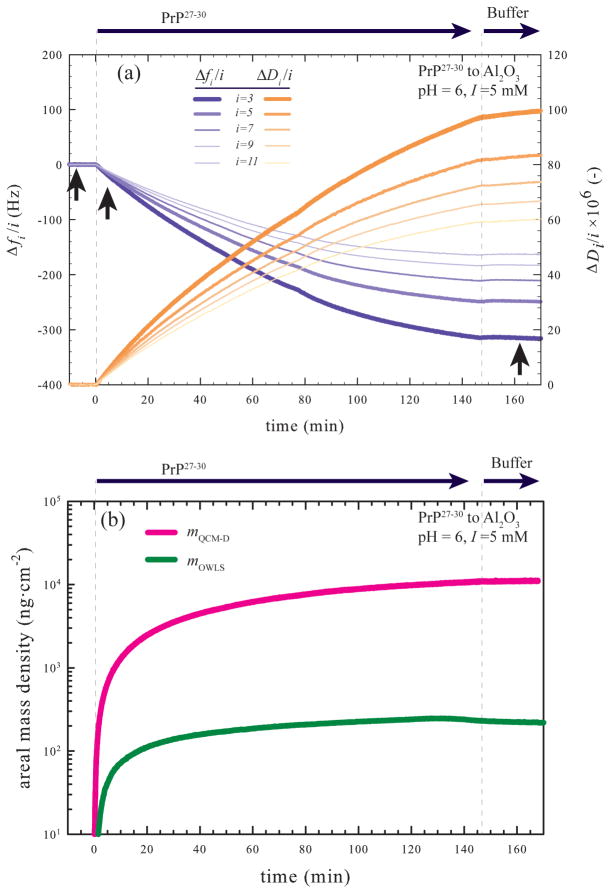
Figure 2.
(a) Representative QCM-D data recording PrP27–30 fibril attachment to Al2O3 at pH 6, I = 5 mM. Upward facing arrows indicate the time points that sensors were removed for AFM imaging (see Figure 4). (b) Areal mass densities of prion fibrils on Al2O3 as determined by QCM-D (mQCM-D) and OWLS (mOWLS). mQCM-D was determined by applying a Kelvin-Voight viscoelastic model45 to the Δfi/i and ΔDi/i data. The density of the adlayer and the density and dynamic viscosity of the bulk phase were set at 1025 kg·m−3, 0.997 kg·m−3 and 0.000910 Pa·s, respectively. mQCM-D includes the mass of all molecules acoustically coupled to the vibrating sensor surface including analyte and solvent (viz. PrP27–30 and water). mOWLS was calculated by applying de Feijter’s equation (eq 1) to the refractive indices measured by the instrument. The experimental effective refractive indices are measured relative to their initial (protein-free buffer) values, mOWLS corresponds to the mass of only the analyte molecules (e.g., PrP27–30) not trapped solvent. Changes in solution chemistries are indicated by arrows above and dashed lines in each plot.

