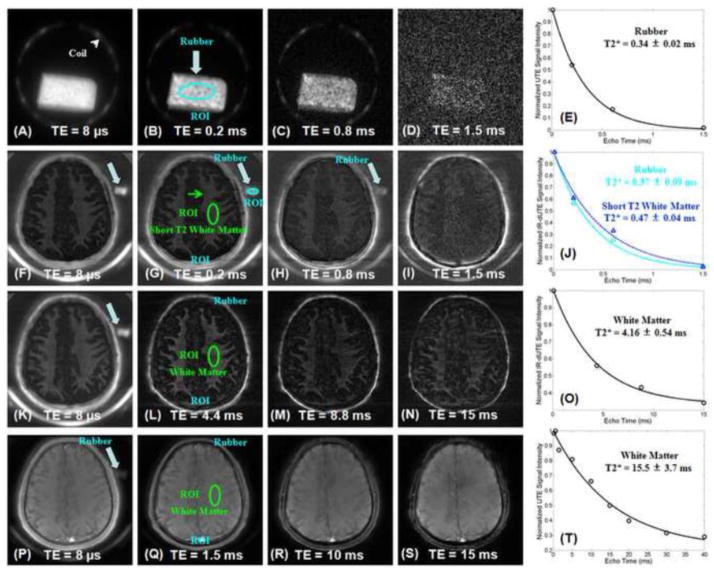
Figure 4.
2D non-slice selective UTE images of the rubber phantom with TEs of 8 μs (A), 0.2 ms (B), 0.6 ms (C) and 1.5 ms (D). Single component fitting shows a T2* of 0.34 ± 0.02 ms for the rubber phantom (E). IR-dUTE subtraction images of a healthy volunteer with a TR of 1000 ms, TI of 330 ms and TEs of 8 μs (F), 0.2 ms (G), 0.6 ms (H) and 1.5 ms (I). Single component fitting shows a T2* of 0.37 ± 0.09 ms for the rubber phantom and a T2* of 0.47 ± 0.04 ms for the ultrashort T2* components in white matter of the brain (J). IR-dUTE images of the same volunteer with a TR of 1000 ms, TI of 360 ms and TEs of 8 μs (K), 4.4 ms (L), 8.8 ms (M) and 15 ms (N). Single component fitting shows a T2* of 4.16 ± 0.54 ms for the same ROI, suggesting longer T2* components contribute to the IR-dUTE signal. Regular UTE imaging of the same volunteer with a TR of 100 ms and TEs of 8 μs (K), 1.5 ms (L), 10 ms (M) and 15 ms (N). Single component fitting shows a T2* of 15.5 ± 3.7 ms for the same ROI, suggesting long T2 components dominate the UTE signal.

