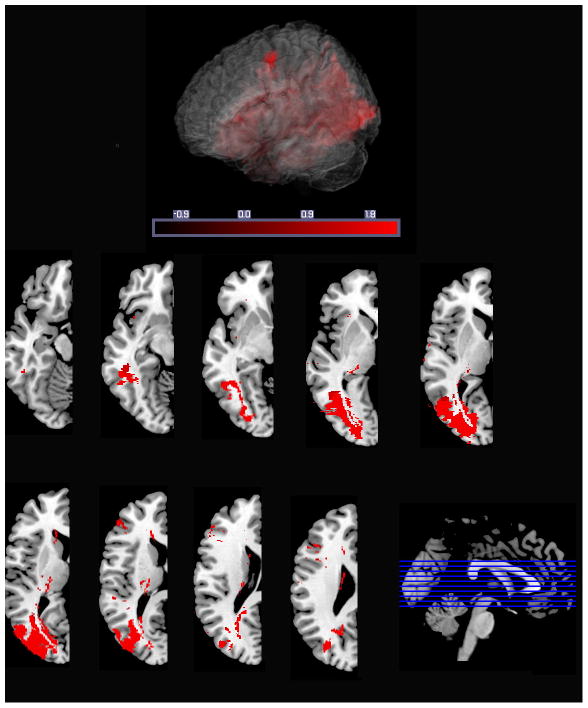
Figure 2.
Lesion correlation rendering
Note: The top view represents the aggregated lesion map overlaid upon the CH2better template brain of MRIcronGL. Slices (below) represent the lesion map overlaid upon a series of ascending left hemisphere axial images. The orthogonal view provides landmarks for these axial slices.

